Useful change begins with a specific question. Work through the ideas below, then use the field exercise to test one of them in context.
Start with a decision
Ask which choice the measure will inform. If a number has no owner, review rhythm, or possible action, it may belong in a reference report rather than the main scorecard.
- Write the decision beside the metric.
- Define the source and calculation.
- Set a review cadence.
Balance outcomes and drivers
Revenue, retention, and delivery quality describe results. Pipeline health, response time, and completed experiments can explain where results may move next. Use both kinds without assuming correlation is causation.
- Limit the primary scorecard to a few signals.
- Compare with a relevant baseline.
- Add context from customers and staff.
Review the system
When a measure changes, inspect the underlying work. Do not reward a target so narrowly that people can improve the number while harming the outcome.
- Check for unintended incentives.
- Annotate major changes.
- Retire metrics that no longer guide action.
The metric-to-decision test
A measure belongs on the main scorecard only if someone can explain the decision it may change. Use this test before adding another chart or target.
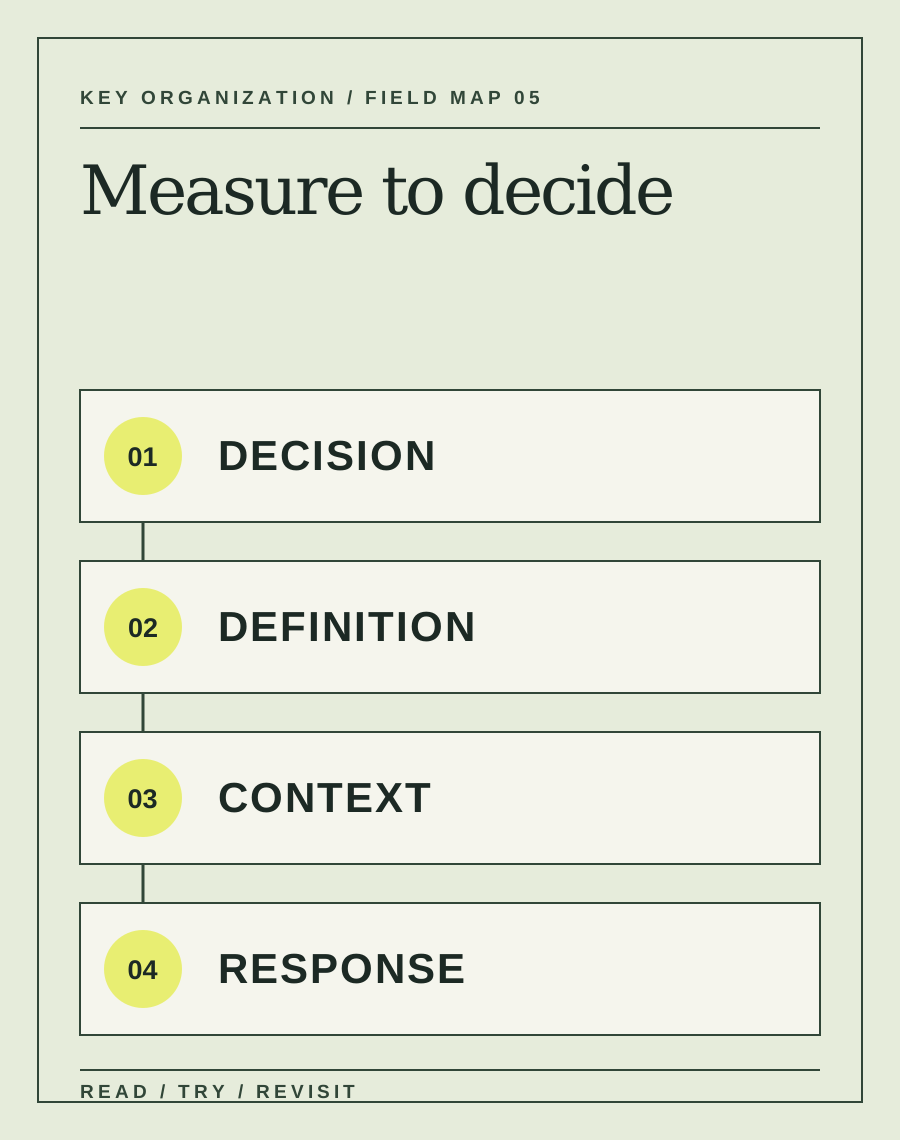
- Decision
Write the choice the team will make when the number changes. If no choice follows, keep the number in a reference report.
- Definition
Record the source, calculation, time window and owner so two people can reproduce it.
- Context
Pair the number with a baseline and one qualitative signal. Ask what else changed during the period.
- Response
Agree on the question to investigate first, rather than treating a threshold as an automatic verdict.
Imagine a support team tracking reply time. A faster average looks positive until customers reopen more cases. Pairing speed with resolution quality leads to a different staffing and training discussion.
When a target becomes a reward, people may improve the number while making the underlying experience worse. Audit the side effects.
RESEARCH CONTEXT / Google re:Work: team effectiveness ↗
Try it in your next workweek.
Pick one meeting. Remove a metric nobody uses and add one question that the remaining measures can answer.